Slower growth and more intense competition in global ELT market
Thanks in large part to increases in the total numbers of junior students – English language training (ELT) student numbers trended up worldwide last year. However, that year-over-year increase in head count is overshadowed by a larger trend in which total volumes of student weeks have fallen over the last five years, with total student numbers largely flat.
In a recent presentation at ICEF Berlin, Maria Cervenanova presented the latest global trends as compiled by StudentMarketing. Ms Cervenanova is a senior research manager with the Vienna-based global market intelligence consultancy, and her overview of ELT trends among eight leading study destinations relies on StudentMarketing’s estimates of language training volumes in each country. These estimates are based on data from multiple sources, including some original research by StudentMarketing.
Those figures reveal that the total volume of student weeks reported for the eight leading ELT destinations has decreased by 7% over five years, falling from roughly 11.9 million weeks in 2013 to just over 11 million weeks in 2017. Meanwhile, overall student numbers for 2017 are more or less on par with the roughly 1.4 million reported for 2013.

Junior students driving numbers
Looking at a shorter and more recent time period, student numbers are up over 2016: moving from roughly 1.33 million in 2016 to 1.4 million in 2017 – but this uptick is again largely due to an increase in junior students who stay for fewer weeks than adults. This explains some of the discrepancy between the 2016–2017 increase in global student numbers and the relatively slow growth in student weeks over the same period.
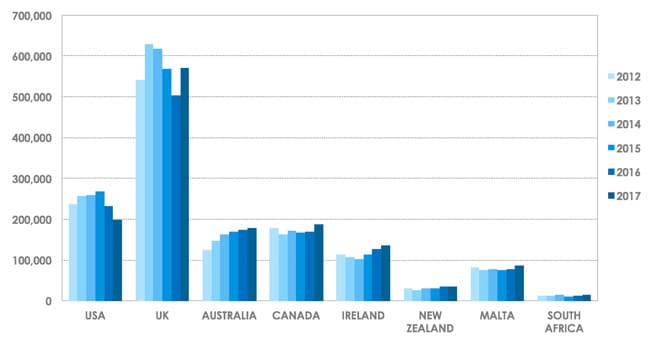
Turning for a moment to the fortunes of individual destinations, the UK in particular has seen gains in student numbers. Roughly 500,000 ELT students studied in the UK in 2016 and this moved to approximately 572,000 in 2017.
As we see reflected in the chart below, Canada, Ireland, and Malta also hosted significantly (but not dramatically) more ELT students in 2016 than in 2017. The US saw numbers fall from approximately 232,000 in 2016 to 198,000 in 2017.

A significant falloff in the US
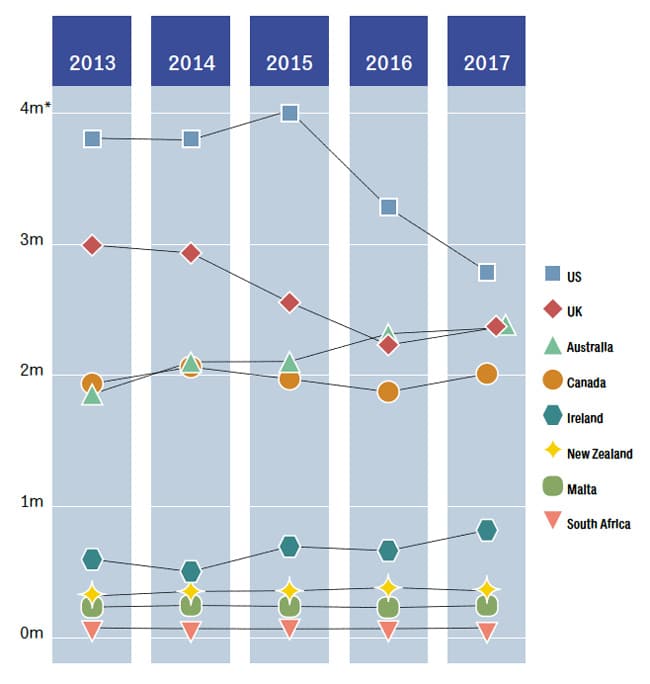
In terms of student weeks, it is again the UK, Canada, and Ireland that registered notable increases in 2017. In the US, weeks fell from roughly 3.3 million in 2016 to 2.8 million in 2017.
Over the five-year time span, notable shifts have occurred in the market share of ELT each destination holds. Currently, the US remains #1, but has lost significant share over the past five years. The UK and Australia are virtually tied, with Canada trailing at some distance.
Meanwhile, the UK is benefitting from its large share of junior students (which accounted for 55% of total enrolment in 2017) while Australia has seen its market share grow steadily over the past five years.


