

China shows greatest improvement in global ranking of higher education systems
The latest global ranking of national higher education systems reveals that China is quickly gaining ground on the US and Europe, and, by some measures, has already surpassed a number of G7 countries.
Indeed, China is the most-improved country in the Universitas 21 Ranking of National Higher Education Systems 2016, and moves up four places this year to be ranked 30th out of the 50 national systems in the sample.
This year’s ranking is the fifth annual table of national higher education systems. Looking back over the period 2013-2016, China again shows the greatest improvement with an overall gain of 12 places over the four years.
China’s progress over this period reflects the rapid development and expansion of the Chinese system and, more specifically, its improvements in the key "Outcomes" factor in the U21 methodology. Outcomes is one of four categories used to calculate the global ranking, and it tracks such variables as research output, enrolment levels, and graduate employment.
The U21 methodology leans heavily on these aspects of system performance, and derives 40% of a country’s overall ranking from such Outcomes variables. Three other categories – "Resources", "Connectivity", and "Environment" - each count for 20% of the total country score.
The ranking is produced by a global consortium of research universities: the Universitas 21 (U21) group. It is the only worldwide ranking that aims to evaluate higher education at a national level. "Our national rankings complement the plethora of rankings of institutions," says the 2016 report. "The rationale for national rankings is that it is the higher education system as a whole, not only of research intensive universities, that matters for the economic and cultural development of a nation...[As such, the ranking] meets a longstanding need to shift discussion from the ranking of the world’s best universities, to the best overall systems."
The U21 scheme is based on 25 variables, including participation, graduate outcomes, spending on tertiary education (as a percentage of GDP), and a qualitative assessment of each country’s policy environment for higher education.
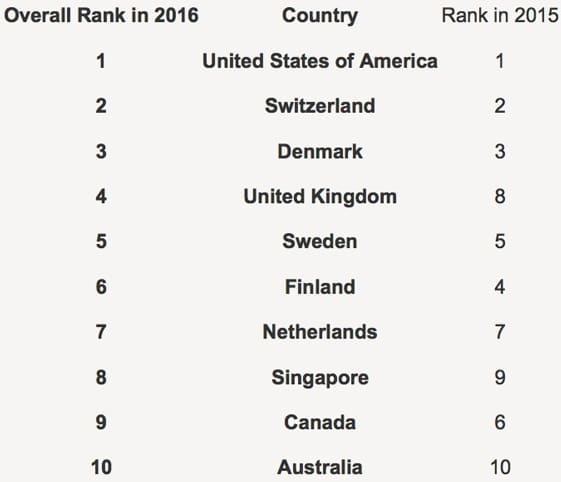
The top 10 countries for 2016 are reflected in the table below. The top three – the US, Switzerland, and Denmark – are unchanged from last year. The UK was the biggest mover in the top 10, gaining four spots from its 2015 position (but this largely on the strength of a methodological change that factors in some previously uncounted public spending on higher education).
What if we factor in price differences?
Beyond its overall ranking table, U21 also publishes a second and separate set of results for which all variables are adjusted to reflect the levels of economic development in each country. The study report explains: "In order to adjust for national levels of income we regress the values for each variable, in original units, on a function of GDP per capita using data for all 50 countries. The GDP we use is for 2013 in US dollars measured in Purchasing Power Parity (PPP) terms."
GDP-as-PPP is a way of comparing economic output by adjusting for differences in price levels between countries. "GDP at PPPs is a better indicator of average living standards or volumes of outputs or inputs, because it corrects for price differences across countries at different levels of development," adds a recent PwC report. "In general, price levels are significantly lower in emerging economies so looking at GDP at PPPs narrows the income gap with the advanced economies compared to using market exchange rates."
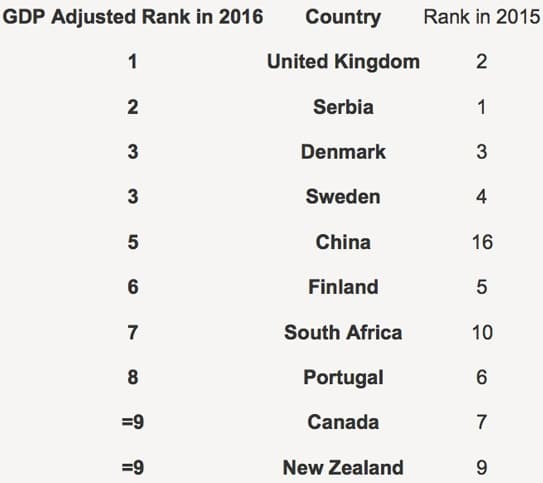
As the following table reflects, the adjusted-for-PPP ranking provides a very different result. In particular, a number of lower-income countries break into the top 10 rankings. A comparison with 2015 also reveals a couple of countries surging within the 2016 results, including South Africa (which moves from number 10 in 2015 to 7th place in 2016) and China (from 16th to 5th).
Most Recent
-
England: Government “remains of the view” that the International Student Levy should go ahead; implementation planned for August 2028 Read More

-
Decline in Indian demand a major factor in softer outlook for foreign enrolment in US higher education in 2026/27 Read More
-
Australia: As visa applications from foreign students fall, the government has set the national target for new international students in 2027 Read More