
Global economic power projected to shift to Asia and emerging economies by 2050
The professional services firm PricewaterhouseCoopers (PwC) has produced a series of megatrends reports that analyse high-level trends expected to shape the global economic landscape in the decades ahead. The latest in the series, The World in 2050: Will the shift in global economic power continue?, describes a dramatic shift in global economic power away from advanced economies and toward Asia and a block of faster-growing emerging economies. PwC’s forecasting models project the world economy will grow at slightly more than 3% per year from 2014 to 2050, and that it will double in size by 2037 and almost triple by 2050. The report adds, however, that after 2020, they anticipate a slowdown in global growth. This is attributed to two main factors: a levelling off of the rate of expansion in China and some other major emerging economies, and a curbed rate of growth in the working age population in many large economies. One of the most compelling findings in the PwC forecast is a projected shift in global economic power away from (currently) leading economies in North America, Western Europe, and Japan over the next 35 years.
The world in 2050, concludes the report, will be very different in terms of the global ranking of national economies and the major drivers of economic growth.
Size matters
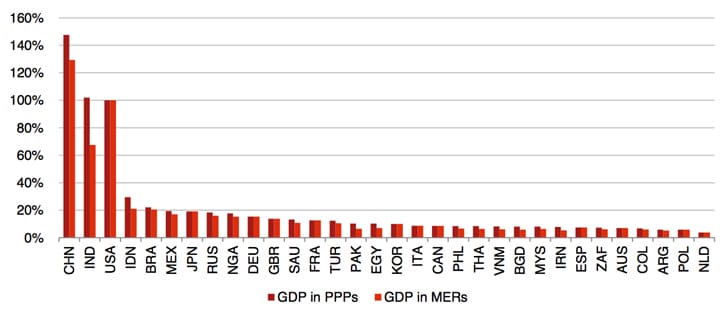
PwC’s forecast model relies on projected trends in demographics, capital investment, education levels, and technological progress. Its analysis compares national economies in two ways. Gross domestic product (GDP) measured via purchasing power parity (PPP) adjusts for differences in price levels across countries, whereas GDP in market exchange rate (MER) terms does not attempt to factor out such price differences from country to country. “GDP at PPPs is a better indicator of average living standards or volumes of outputs or inputs, because it corrects for price differences across countries at different levels of development,” notes the report. “In general, price levels are significantly lower in emerging economies so looking at GDP at PPPs narrows the income gap with the advanced economies compared to using market exchange rates. However, GDP at MERs is a better measure of the relative size of the economies from a business perspective.” The difference between the two is important in terms of providing a more nuanced understanding of relative economic growth and size. For example, China has already overtaken the US (as of 2014) to become the world’s largest economy in PPP terms, and is projected to surpass America in terms of MER GDP values by 2028. Other notable projections include:
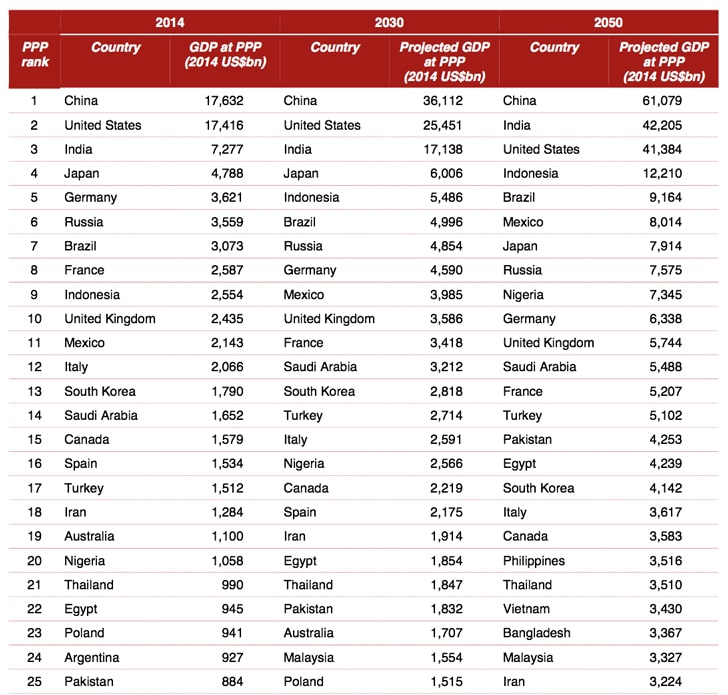
- India will be the second-largest economy in the world by 2050 (in PPP terms, that is, and third when measuring GDP via MERs).
- Emerging economies Mexico and Indonesia will be larger than the UK and France by 2030 (again, when measuring GDP in PPP terms).
- Nigeria and Vietnam are expected to be the fastest-growing large economies through 2050.
The following table shows the current global ranking of world economies as of 2014 and the projected rankings for 2030 and 2050, all in PPP terms. Keep in mind that today's newborns will be in secondary school in 2030.
The groups of seven
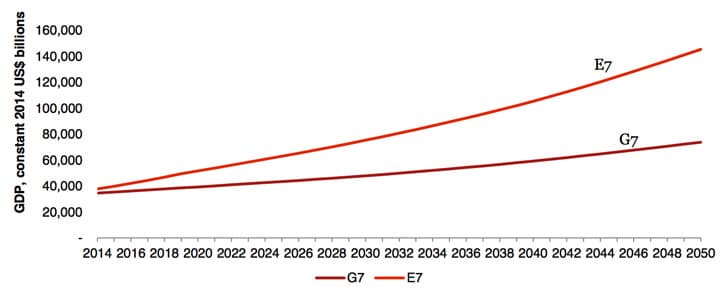
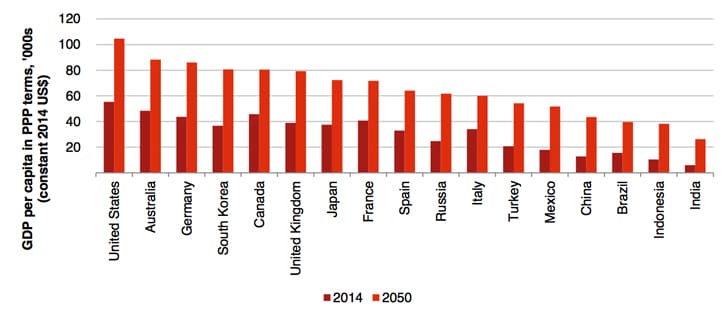
PwC also compares two key groups of countries: a modified “G7” grouping (Canada, France, Germany, Italy, Japan, the UK, and the US, plus Australia, South Korea and Spain) and the “E7” - that is, the seven-largest emerging market economies (Brazil, China, India, Indonesia, Mexico, Russia, and Turkey).
The following chart shows the projected growth trends for both the G7 and E7 groups through 2050.
Mind the gap
Another startling projection in the PwC forecast is that the gap between the three biggest economies - China, India, and the US - and the rest of the world will widen in the coming decades.
“In 2014, the third biggest economy in PPP terms (India) is around 50% larger than the fourth biggest economy (Japan). In 2050, the third biggest economy in PPP terms (the US) is projected to be approximately 240% larger than the fourth biggest economy (Indonesia).”
Bringing forecasts down to earth
The type of “megatrends” forecast that PwC offers in its report is useful for just that: a consideration of high-level trends that point towards major shifts in the world economy. And the major shift in question here is a transfer of economic power from advanced to emerging economies. On this point, PwC concludes, “Given the rise of India and China, our model suggests that the US and the EU’s share of world GDP in PPP terms will face a steady decline from around 33% in 2014 to only around 25% by 2050. This shift of global economic power to Asia may occur somewhat more quickly or slowly than this, of course, but the general direction of change and the historic nature of this shift are clear.” The implications for individual trading partners or organisations are of course less clear. But what PwC is describing here is not merely a shift in the relative size of economies; it is a profound transfer of economic and political influence across the globe. Whereas today we talk about emerging education hubs in Asia and elsewhere, by 2050 we may be reflecting on a remarkably different landscape for international education as well.
Most Recent
-
Decline in Indian demand a major factor in softer outlook for foreign enrolment in US higher education in 2026/27 Read More

-
Australia: As visa applications from foreign students fall, the government has set the national target for new international students in 2027 Read More
-
Independent K-12 schools in the UK hosting fewer international students this year Read More