


US student visa data the latest indicator of international enrolment trends
The latest SEVIS by the Numbers report provides a snapshot of foreign enrolment in the US as of 5 March 2018. It finds the number of international students in the country decreased marginally (-.5%) when compared to March 2017’s enrolment levels. As always, the SEVIS data is interesting for its ability to provide something close to a real-time snapshot of student numbers in the US. This is distinct from the landmark Open Doors survey conducted by the Institute of International Education, which relies on data from the previous academic year. It can also be distinguished from other US government data focused on visa issuance, which reflects the volume of commencements and visa renewals for a given period. Each of these data sources contributes to our understanding of the evolving enrolment trends in the US, and this latest SEVIS data release underscores on observation that has been made of the US market over the last year. For the first time in decades, foreign student numbers in the country are not only not growing substantially, they have actually declined. Of particular interest to international recruiters are the SEVIS numbers for F-1 and M-1 visa holders, where:
- F-1 students are “non-immigrant students coming to the United States to pursue a full course of academic study in SEVP-certified schools;” and
- M-1 students are “non-immigrant nationals pursuing a full course of study at a SEVP-certified vocational or other recognised nonacademic institution (other than in language training programmes) in the United States.”
The latest data reflects that the total number of active F and M students decreased by .5% over the past year, from from 1,208,039 in March 2017 to 1,201,829 as of March 2018. Much of this decline appears to have been among students seeking two-year associate degrees in the US, whereas the numbers of those pursuing bachelor’s and master’s degrees held relatively stable throughout the year.
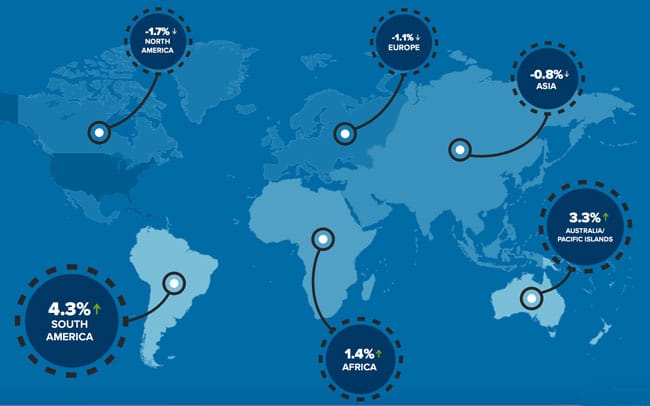
Sending trends
As the following illustration reflects, the number of Latin American students in the US actually increased by more than 4% over the year, but those gains were offset by marginal declines from European and Asian markets.
- “Scale of OPT growth revealed as US administration contemplates reforms”
- “US F-1 visas down nearly 17% in 2017”
- “American graduate schools report decline in international applications and commencements”
- “US ELT numbers trending down in 2017”
- “Record-high foreign enrolment in US but commencements decline for the first time in 12 years”